A special issue book reprint entitled Marine Oil Spills 2018 includes an article by Dr. Zhen Li and Dr. Walter Johnson in BOEM’s Division of Environmental Sciences, Oil Spill Risk Analysis program, entitled, “An Improved Method to Estimate the Probability of Oil Spill Contact to Environmental Resources in the Gulf of Mexico.” The book, published by the Journal of Marine Science and Engineering, is an OPEN ACCESS compilation of 14 papers presenting new developments in the field of oil spills, giving insight into the rapidly changing world of oil spill studies and technology.
BOEM uses the oil spill risk analysis (OSRA) model as a tool to evaluate oil spill risks to biological, physical, and socioeconomic resources that could be exposed to oil from oil and gas leasing, exploration, or development on the U.S. Outer Continental Shelf (OCS).
Using long-term hindcast wind and ocean current data, the OSRA model generates hundreds of thousands of trajectories from hypothetical oil spill locations and derives the probability of contact to environmental resources on the U.S. OCS and adjoining coasts, under the assumption that the spill occurs at the hypothetical spill locations. This is the first step of estimating the probability of oil spill occurring and contacting the environmental resources. However, utilizing the OSRA model to meet the required National Environmental Protection Act (NEPA) analyses still proves to be a challenge, especially when a lease sale is announced without adequate time to perform an updated OSRA model run.
This study attempts to provide a solution that will speed up the OSRA process by extracting the probability from an existing database that is pre-calculated using the existing wind and current data without re-running the model. With this method, the probability can be derived from a probability database and used in NEPA analyses for any lease sales. This study uses the Gulf of Mexico as an example, the method can be applied to other OCS regions and help improve BOEM’s decision-making process.
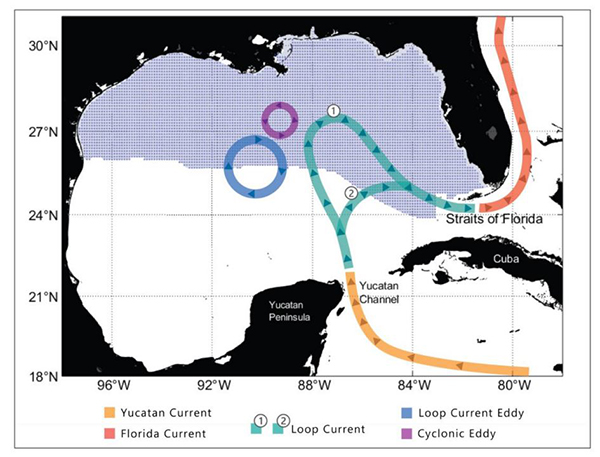
Figure 2 from the article
Map of the GOM used for the OSRA model simulation with schematic drawings showing the Loop Current and Loop Current Eddy. Blue dots denote hypothetical oil spill locations.


